The aviation weather app can be downloaded for free from the Apple AppStore. The free version gives you the opportunity to prepare for your flight giving you aviation weather from several sources. The app works worldwide1.
The free app is fully functional. For some advanced features, such as support for in-flight weather via the Iridium Go! device, you have to buy a yearly subscription as an in-app purchase from the Apple AppStore.
The first month of that subscription is a free trial, after which you can cancel your subscription at any time. The subscription is fully managed through your Apple AppStore account.
Free App
Subscription (yr)
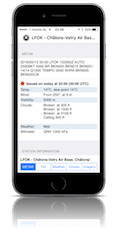
1 Worldwide coverage. Not all airports have a weather station or produce weather forecasts (TAF). Search for nearby airports that have weather to create a total picture of the weather to expect during your flight.
2 The further ahead in time you want to get a forecast, the fewer the number of airports that can provide you with a TAF forecast. The airports that cannot forecast that far ahead will turn grey on the map as you move the time slider forward in time.
3 The numerical value of the Lifted Index gives you a good indication of whether the air is potentially stable or unstable in that area and timeframe. A Lifted Index number of zero indicates air that is neutrally stable. A Lifted Index number above zero indicates stable air. A Lifted Index number below zero indicates potentially unstable air. Lifted index 0 to -2 means weak potential instability of the airmass. A Lifted Index value of -2 to -6 means that the airmass is likely moderately unstable and if the Lifted Index value is smaller than -6, the airmass is potentially very unstable and could indicate a high possibility of Thunderstorm activity. For Thunderstorm activity the airmass does not only need to be unstable, but also include a lot of moisture amongst other factors, but a negative Lifted Index number is a good first indication to watch out and check against other sources for potential weather hazards.
4 CAPE stands for Convective Available Potential Energy and is a measure of joules of energy per kilogram of air. The larger the CAPE value, the more potential energy trapped in the air. It is another means of measuring how potentially unstable the air might become. A value of 0 means Stable air. A CAPE value between 0 and 1000 means Marginally Unstable air. Is the value between 1000 and 2500 the airmass is potentially Moderately Unstable, 2500-3500: Very Unstable and more than 3500 for the CAPE value indicates potentially Extremely Unstable air with a very high potential for Thunderstorm activity.
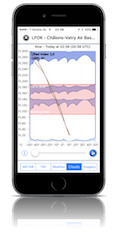
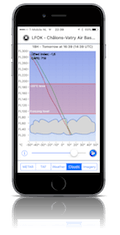
5 The Clouds Diagram in our app is a simplified form of the more complex Tephigram and Skew-T Log-P diagrams often used by meteorologists to create a visual snapshot of the atmosphere. On the horizontal x-axis, we show the temperature in degrees Celsius. On the vertical y-axis, we provide the altitude in flight levels (FL). This diagram can be used to give you an idea of the altitude at which you could possibly expect clouds to form. It can also be used to estimate the cloud tops or also called top-of-clouds. The red line shows the dew point temperature aloft. The green line shows the ambient temperature aloft. When the dewpoint temperature is reached, the relative humidity in the air will be 100% and clouds will most likely form. There where the green and red lines meet and touch each other you could possibly expect clouds. Where they divert away from each other, you could possibly expect a top of clouds or clouds top. Combine interpreting this Clouds Diagram with the information provided in the METAR and TAF section on clouds ceilings and then combine this with a good look at the infrared (IR) satellite images to get a forecast of where the top of clouds could possibly be. Remember that the Clouds Diagram is based on a weather model and not on actual observation, so you interpret the information in the Clouds Diagram ideally together with e.g. information taken from satellite infrared images to get a good overall picture.
6 Map overlay showing the expected top-of-clouds altitude in FL The data is based on weather model data. To determine the top-of-clouds, combine this model data with the IR cloud top temperature satellite images.
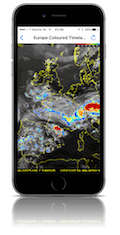
7 The infrared satellite images provided give a picture of the cloud top temperature. Unfortunately, there is no temperate or altitude scale provided with the infrared images, but with a little bit of experience, you will be able to get a rough idea of where the tops of clouds are, and if they will be closer to FL100 than to e.g. FL200. Use this satellite-derived information together with the data from the GFS weather model we provide in the Clouds Diagram and other weather sources to get a complete picture of what to expect on your next flight. Very high cloud tops are colder in temperature and thus more white in colour. Lower cloud tops will have a grey colour. The source of these IR images is EUMETSAT and can be seen as a kind of “cloud tops METAR”. The data from the Clouds Diagram comes from a weather model and is not based on actual observation. Taken together you can get a good idea of where to expect the top of clouds.
8 ESTOFEX: European storm prediction experiment.
9 In SAT mode we replace the dynamically loaded background map with an embedded low-resolution version. This way you won’t be downloading map data over a satellite or LTE/4G connection. In SAT mode the weather is not updated automatically. You will have to press the refresh/reload button to initiate a download of the latest rain radar and lightning/strike data (if available to you). This download takes approx. 2-5 minutes using a Thuraya SatSleeve or Iridium Go! device To get an update for the METAR/TAFs for a specific airfield, you click on the airport icon, then on the ‘i’ button on the right and then on the refresh/reload icon to request the latest weather for that specific airport. SAT mode works with an Iridium Go! device, the Thuraya SatSleeve satellite phone GmPRS network or it might work with your LTE/4G data network on your phone.
10 The latest Iridium Go! device from Iridium creates a WiFi network in your aircraft that allows up to 5 mobile devices, tablets and smartphones to communicate through the device and satellite network. Users can place voice calls, send text messages, update their social media accounts. The data-speed is slow over the Iridium satellite network, but sufficient for getting the latest weather or making a call.
11 This data is currently only available to select customers!
We include “worldwide” rain radar as well as lightning/strike data in our app as an overlay on the map. Worldwide means that there where rain radar and lightning data is available it is included. At the moment, rain radar is available in North America, Central America, Western Europe and Australia. Rain radar and lightning data can only be downloaded when you turn our app into ‘SAT mode’. To get the latest data in SAT mode, press the refresh button (second button, top left on the map). By pressing the ‘refresh’ button we will download the latest strikes of the last 1-2 minutes. You will get only the latest rain radar and strike data which is a great way to receive only the data you need when on a satellite data connection. Pressing the refresh button will first download the latest rain radar image for the map area you selected. After that, the latest strikes are downloaded for the whole world. With a good satellite data connection with e.g. a Thuraya Satsleeve, this will take less than 2 minutes and will not exceed more than approx. 70KB of data. With the Iridium Go! device, it takes longer. The rain radar data is updated approximately every 10-15 minutes with possibly new rain radar data. The lightning/strike data is provided more or less real time. Be aware of the delay in the data you see on your tablet or smartphone. The information is provided as an additional reference source and not to be used as the basis for your weather penetration decisions. Always avoid bad weather and use approved and official weather radar and data where available.